
The body content of your post goes here. To edit this text, click on it and delete this default text and start typing your own or paste your own from a different source.

The body content of your post goes here. To edit this text, click on it and delete this default text and start typing your own or paste your own from a different source.
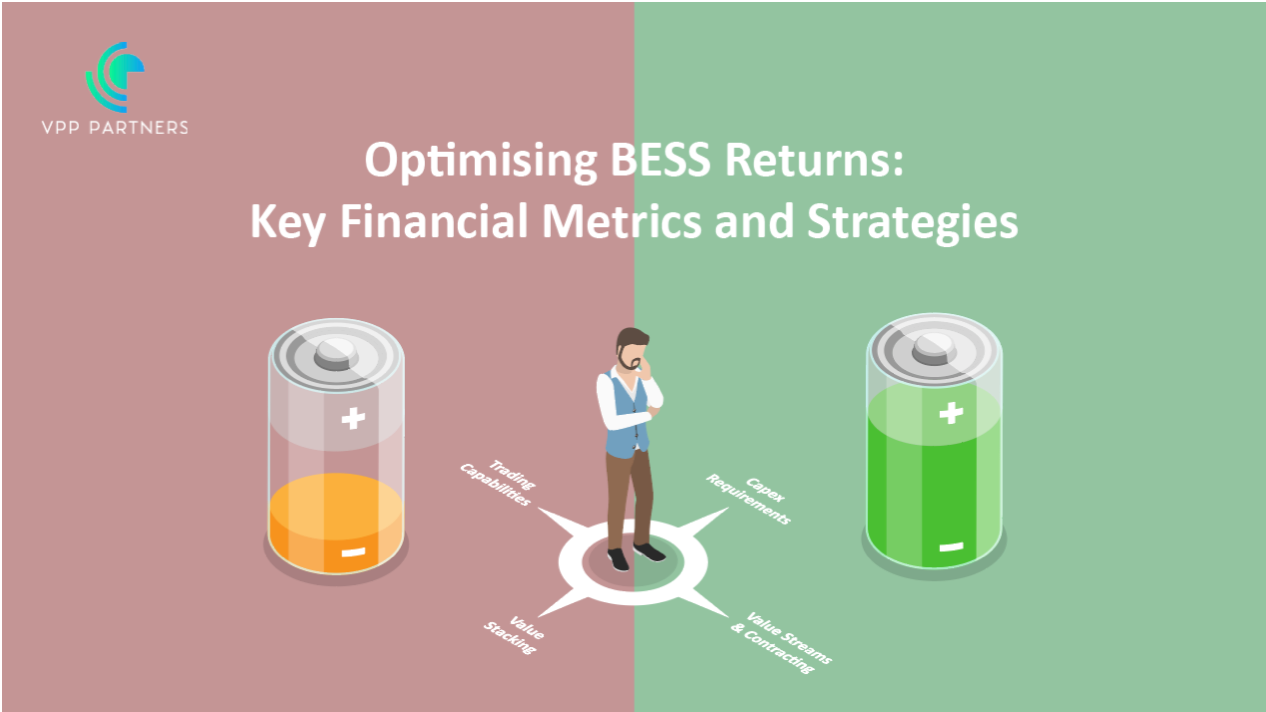
Here at VPP Partners we are always thinking about all things energy. The energy transition and all the moving parts are complex and looking for ways to demystify the challenges and help overcome them is one of our key drivers. Recently, VPP Partners's Energy Specialist Lachlan Ryan built a model to answer a question that he had been toying with for some time. The question was along the lines of “There must be a way to create a graph that would show the required spread between charge and discharge for a BESS in the wholesale electricity market for different capital costs to meet a desired financial metric”. It was believed that this would help to demonstrate a few different aspects relating to batteries in the NEM: Understanding Capex Requirements: Enabling the quick identification of the capex ranges required to get reasonable project returns based on expected charge and discharge prices. Highlighting Value Stacking: Highlighting that value stacking with other value streams is likely needed to meet the required financial returns. Value streams and contracting: Understanding your value streams and the potential importance of contracting your assets to firm up revenue. Trading capabilities: The requirement for competent trading capabilities to realise as much value as possible from the market. Key Assumptions The model itself had several assumptions that are highlighted as follow: Target internal rate of return (IRR): 12%, 15%, 18% Round trip efficiency (RTE): 85% (losses applied to charge cycle) Annual degradation rate: 3% Depth of discharge (DoD): 90% Cycles per day: 1.5 Project duration: 15 years Interest rate: 0% (self-funded model) The Challenge of Real-World Charging Prices A critical assumption in this model is that the battery charges at $0/MWh, which means the spread is equal to the discharge price. However, in real-world scenarios, the battery won't always charge at $0/MWh, and due to the round-trip efficiency (RTE), the actual required spread isn’t straightforward. For example: A 1MWh BESS charging at $0/MWh and discharging 0.85MWh (with 85% RTE) at $100/MWh results in a margin of $85/MWh. If the battery charges at $100/MWh and discharges at $200/MWh (maintaining a $100/MWh spread), the margin drops to $70/MWh. To achieve the same $85 margin, you would need to discharge at $217.6/MWh. This led to a redefined the problem: Instead of calculating the required spread, the result was required profit per MWh for all discharged energy. This model created the graph ‘Required Profit vs Cost of BESS’, where the x-axis is the capital cost of the battery system, and the y-axis is the required $/MWh profit required for all the discharged energy.
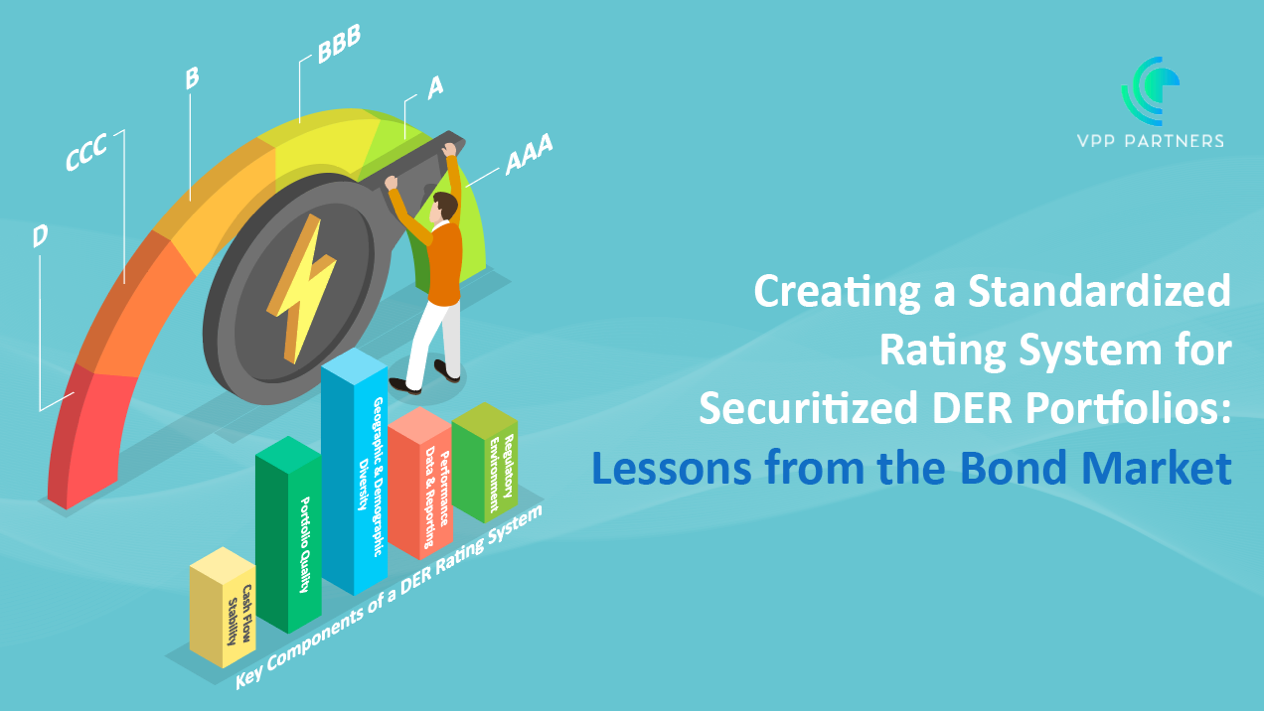
As distributed energy resources (DERs) like rooftop solar, energy storage, and EV infrastructure grow and attract more capital, the industry faces unique challenges in securitizing and rating these assets. Investors looking to get into DERs face significant costs and complexities in conducting due diligence across thousands of geographically dispersed assets. This fragmentation is quite different from traditional energy investments in centralized power stations, which are easier to assess due to their single-location nature. The solution might be found in a familiar approach from financial markets: a standardized rating system similar to what the bond market uses. By establishing ratings based on cash-flow stability, portfolio quality, and geographic diversity, the DER sector can create transparency, reduce due diligence costs, and make securitized DER portfolios a more accessible and standardized asset class. In this article, we’ll explore how adopting bond-market-style rating mechanisms could enhance the DER securitization landscape. The Power of Ratings: Lessons from the Bond Market The bond market is one of the world’s largest and most liquid financial markets, attracting trillions of dollars in investment annually. One reason for its success is its transparent, universally accepted rating system, ranging from “A grade” or investment-grade bonds to high-yield “junk” bonds. This rating system, developed by agencies like Moody’s, S&P, and Fitch, standardizes asset assessments, allowing investors to easily compare bonds based on creditworthiness, expected return, and risk. This universal rating system has lowered transaction costs for investors in bonds by reducing the need for extensive due diligence. Investors rely on these ratings to gauge risk, allowing for efficient capital allocation without having to assess each bond individually. This transparency and ease of comparison have enabled the bond market to grow and become a mainstay in both public and private investment portfolios. The Distributed Nature of DER Portfolios: Complexity and Challenges Unlike a bond or centralized power station, a distributed energy portfolio could comprise thousands of assets in varied locations, each with its own unique performance profile, customer type, and regulatory considerations. The sheer scale and dispersed nature of DER portfolios create high due diligence costs and operational complexity. Each asset within the portfolio contributes a small portion to the total cash flow, but their individual performance and risks are harder to assess. The absence of a standardized, widely accepted rating system means investors must perform labor-intensive analyses on each DER portfolio to evaluate potential risks and returns. This complexity increases transaction costs, which can dampen interest in investing in these portfolios and limit the liquidity of securitized DER assets. Developing a DER Rating System: Key Components The bond market’s rating system provides a valuable template for DER portfolios. Here’s how a similar approach might work: Cash Flow Stability: Rating agencies assess bonds based on the borrower’s ability to maintain steady payments. For DERs, cash-flow stability would be evaluated based on factors like customer payment history, contract terms, and system performance. Ratings would reflect how reliably the portfolio can generate returns, helping investors easily assess income predictability. Portfolio Quality: Just as corporate bonds are rated based on company health and leverage, DER portfolios could be rated based on the quality of underlying assets. For example, portfolios with newer technology, longer asset warranties, and reliable maintenance schedules could achieve higher ratings than those with older assets or minimal servicing plans. Geographic and Demographic Diversity: Bond markets rate based on issuer stability; similarly, DER portfolios would benefit from geographic and customer diversity. Portfolios spread across stable markets or a mix of demographics (residential vs. commercial users) would receive higher ratings, reflecting reduced exposure to localized regulatory or economic shocks. Performance Data and Reporting: Rating agencies rely on companies’ quarterly earnings reports and disclosures to maintain bond ratings. A standardized data-reporting framework would be essential for DER portfolios, providing consistent performance metrics that enable investors to track and assess portfolio health. Regulatory Environment: Just as bonds are subject to regulatory risk, so too are DERs. Ratings could incorporate an assessment of regulatory stability within the portfolio’s operational regions. Portfolios in states or countries with supportive renewable energy policies would likely score higher, while those in volatile policy environments might face lower ratings. Benefits of a Standardised DER Rating System Implementing a standardized rating system for DER portfolios would bring significant advantages for both investors and DER developers, reducing transaction costs, expanding the investor pool, and enhancing portfolio liquidity. Reduced Due Diligence Costs: A standardized rating would offer investors a shortcut to understanding risk, minimizing the need for extensive individual asset assessment. Much like bond ratings, DER ratings could summarize portfolio quality, stabilizing investor confidence and accelerating the decision-making process. Increased Liquidity: A universal rating framework would create market familiarity, making it easier for investors to buy and sell DER-backed securities. With transparent and comparable ratings, the DER asset class would gain greater acceptance, potentially leading to the development of secondary markets for trading these securities, much like the bond market. Attracting a Broader Investor Base: Many institutional investors who are risk-averse but interested in renewable energy lack familiarity with DERs. A standardized rating system offers a risk assessment they can trust, creating a pathway for more investors to enter the DER market. Additionally, ratings would help differentiate higher-quality DER portfolios, attracting capital from impact investors looking for stable, ESG-friendly assets. Enhanced Capital Efficiency: Ju st as high-grade bonds achieve lower interest rates, well-rated DER portfolios would benefit from lower costs of capital. This rating-driven efficiency could also make DER-backed securities more competitive against traditional investments, supporting faster capital deployment in renewable energy markets. Challenges to Establishing a DER Rating System Implementing a rating system for DER portfolios is not without challenges. The diversity of DER types, from residential solar to electric vehicle charging stations, makes it difficult to create a “one-size-fits-all” model. Additionally, inconsistent data across asset types complicates performance benchmarking. And because DER assets are relatively new, the lack of historical performance data creates uncertainty for ratings agencies trying to estimate long-term cash flow stability. Moreover, regulatory differences across regions add layers of complexity. Unlike bonds that operate under established financial regulations, DER portfolios operate under a patchwork of energy regulations, with different jurisdictions applying varying rules for DER performance, incentives, and contract terms. However, as the market matures, regulatory frameworks for DERs are likely to become more cohesive, and data availability is expected to improve. These developments will pave the way for more accurate and reliable ratings, gradually addressing today’s challenges. Moving Toward a Standardised Future As the energy landscape evolves, a standardized rating system for DER portfolios could play a crucial role in making these investments more accessible and attractive. By learning from the bond market, the DER sector can create a transparent, efficient, and scalable investment environment that supports the growth of clean energy. Contact us today at hello@vpppartners.com
Originally posted on LinkedIn on 30 October 2024
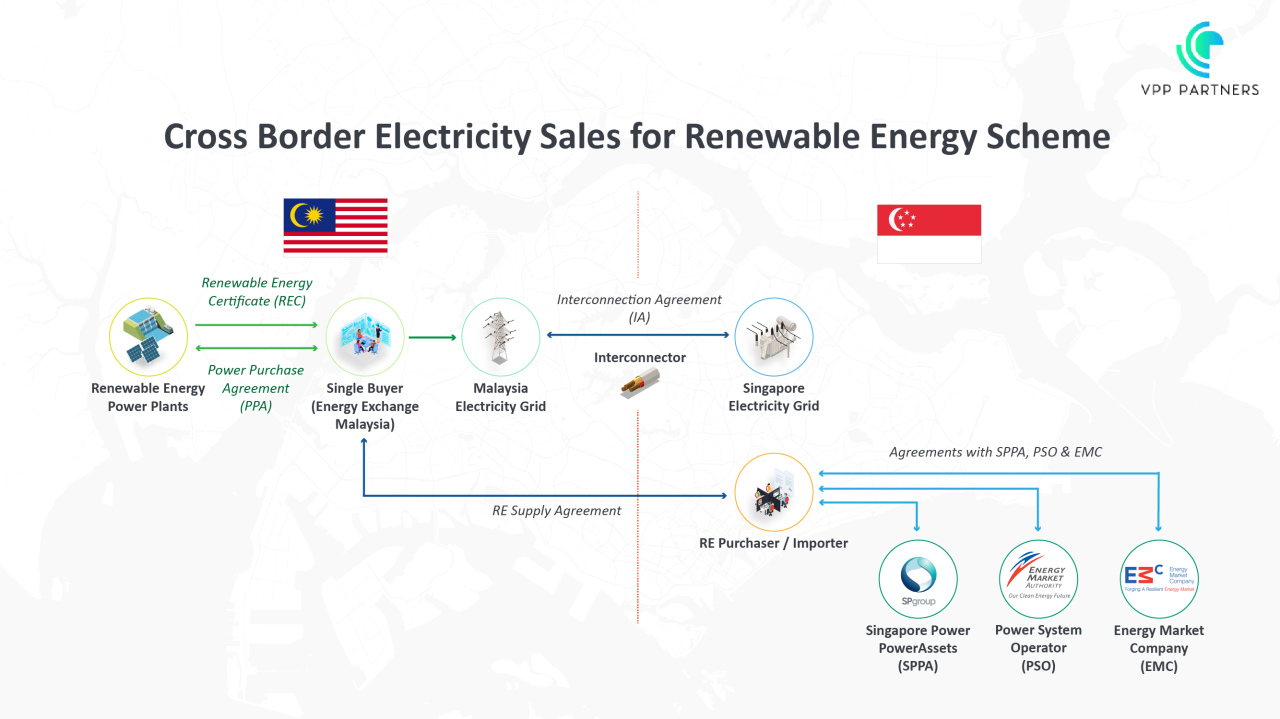
Introducing Malaysia’s Corporate Renewable Energy Supply Scheme (CRESS) Malaysia is taking a significant step towards a greener future with the planned launch of the Corporate Renewable Energy Supply Scheme (CRESS) this September. This initiative, part of the GREENS MADANI Initiative, aims to enhance corporate access to green electricity and support the country’s energy transition goals. What is CRESS? CRESS is a framework designed to allow renewable energy producers and corporate consumers to arrange green electricity supplies through an open grid access model. This means third parties can supply or acquire electricity via the grid network system with a predetermined system access charge. Framework and Parties Involved Under CRESS, renewable energy producers and eligible corporate entities can negotiate and agree on terms for green electricity supply. The Energy Commission will regulate the program, while the Single Buyer (SB) and Grid System Operator (GSO) will manage market and system operations. Tenaga Nasional Berhad (TNB) will continue as the electricity utility supplier, ensuring consistent delivery of electricity.
To unlock the full potential of the growing Battery Energy Storage System (BESS) market, it's crucial to correctly assess returns to attract more investment in sustainable energy projects. With the rapid evolution of energy technologies and market dynamics, investors and developers alike face challenges in evaluating risk-adjusted returns, which are essential for securing funding and ensuring the financial success of these ventures. Without accurate and comprehensive assessments, projects risk being underfunded or failing to achieve their intended outcomes, stalling progress in the clean energy transition. Risk-adjusted returns for Battery Energy Storage System (BESS) projects measure the profitability of the investment while accounting for the risks involved. This is crucial because BESS projects can have significant financial and operational risks, such as technology failures, regulatory changes, and market volatility. Key Factors in Risk-Adjusted Returns for BESS Projects Revenue Streams : BESS projects can generate revenue through various means, including energy arbitrage, frequency regulation, and capacity payments. Each revenue stream has its own risk profile. Cost Considerations : Initial capital costs, operational and maintenance costs, and potential costs related to technology failures or safety incidents must be factored in. Market Risks : Fluctuations in energy prices, changes in regulatory policies, and competition from other energy sources can impact returns. Technological Risks : The reliability and lifespan of the battery technology used can affect the project’s financial performance. Incidents like thermal runaways or other failures can lead to significant losses. Financial Metrics : Common metrics used to assess risk-adjusted returns include the Sharpe ratio, which measures the excess return per unit of risk, and the Sortino ratio, which focuses on downside risk. A thorough project-level analysis is essential to accurately assess the financial viability of a BESS project. This includes evaluating technical merits, market conditions, and potential risks to optimise returns and ensure long-term success. How We Can Help At VPP Partners, we specialise in helping companies identify and quantify the risks associated with BESS projects. Our structured approach ensures that all potential risks are thoroughly assessed and managed. Here’s how we can assist: Risk Mapping : Mapping your opportunity against your risk appetite and risk tolerances. Initial Assessment : We conduct preliminary meetings to understand your project’s scope, goals, and context. Risk Identification : Using techniques like brainstorming sessions and expert interviews, we identify risks related to technology, market, finance, and operations. Risk Analysis : We perform qualitative and quantitative risk analysis using tools like Failure Mode and Effects Analysis (FMEA) and decision tree analysis. Risk Quantification : We use statistical models and financial metrics to estimate the cost implications of risks. Risk Mitigation Planning : We develop strategies to mitigate identified risks, including preventive measures, contingency plans, and insurance options. Risk Tracking & Governance : Develop value at risk tracking and controls to ensure operations can be adapted as markets and technology changes. Implementation and Monitoring : We help implement risk mitigation strategies and monitor their effectiveness, ensuring your project stays on track. Reporting and Communication : We prepare regular reports and conduct meetings to keep stakeholders informed about risk management activities and outcomes. By partnering with us, you can ensure that your BESS projects are not only profitable but also resilient to the various risks they may face. Contact us today to learn more about how we can support your energy storage initiatives.
In a previous article , we had covered the what the ‘DRAFT National Electricity Amendment (Unlocking CER benefits through flexible trading) Rule 2024’ was proposing, as the final determination was made on the 15th of August, we have decided to revisit the topic and point out any differences to the draft and the proposed timeline of implementation. The proposed live date for what the new rule is proposing is the 2nd November 2026. What are the differences between the final determination and the draft? A few changes and clarifications have been made between the two documents, some of which are from stakeholder feedback, these include: NMI Service Provider Role : Initially, DNSPs were proposed to establish and maintain NMIs. The final determination assigns this role to a new accredited NMI service provider, reducing costs and implementation time. This role is equivalent to an embedded network manager role and would be provided to a contestable party. Large Customer Eligibility: The final rules clarify that large customers can aggregate loads across multiple sites to meet the threshold for flexible trading, which was not explicitly detailed in the draft. De-energisation Rules: The final determination prohibits separate de-energisation of secondary settlement points (SSPs – Secondary Settlement Points) to protect vulnerable consumers, a change from the draft rules. Technical Requirements: Stakeholders provided feedback on metering requirements, such as the need for meters to have alternative data access methods (e.g., smartphone apps) and concerns about flow limits and accuracy. The final determination retains the draft position but incorporates stakeholder feedback to ensure practical implementation this includes ensuring that meters are accurate and capable of handling the required flow limits without compromising performance. Market Participant Roles : Stakeholders expressed concerns about the complexities of compliance with dynamic operating envelopes and the allocation of tariffs. The final determination addresses these concerns by outlining clear roles and responsibilities for market participants. Timeline of Implementation As this is a fairly big change, there will be different stages of implementation, as such, we have provided a timeline of events below. Please note that the timeline in the ‘Final Determination’ is still a draft and will have to be finalised by the 30th September 2025. Please note that the ‘Final determination’ was a month late, so it is likely the below will be delayed. 15th August 2024 : Final determination made. 29th August 2024 : removal of the requirement for meters to have a visible display (to accommodate in-built meters with displays on an app). 30th September 2025: AEMO guideline and procedure changes. 31st May 2026: arrangements related to type 9 metering. 1st November 2026: arrangements related to meter types 8A and 8B, SSPs, and changes to the NERR and retail contracts (the live date).
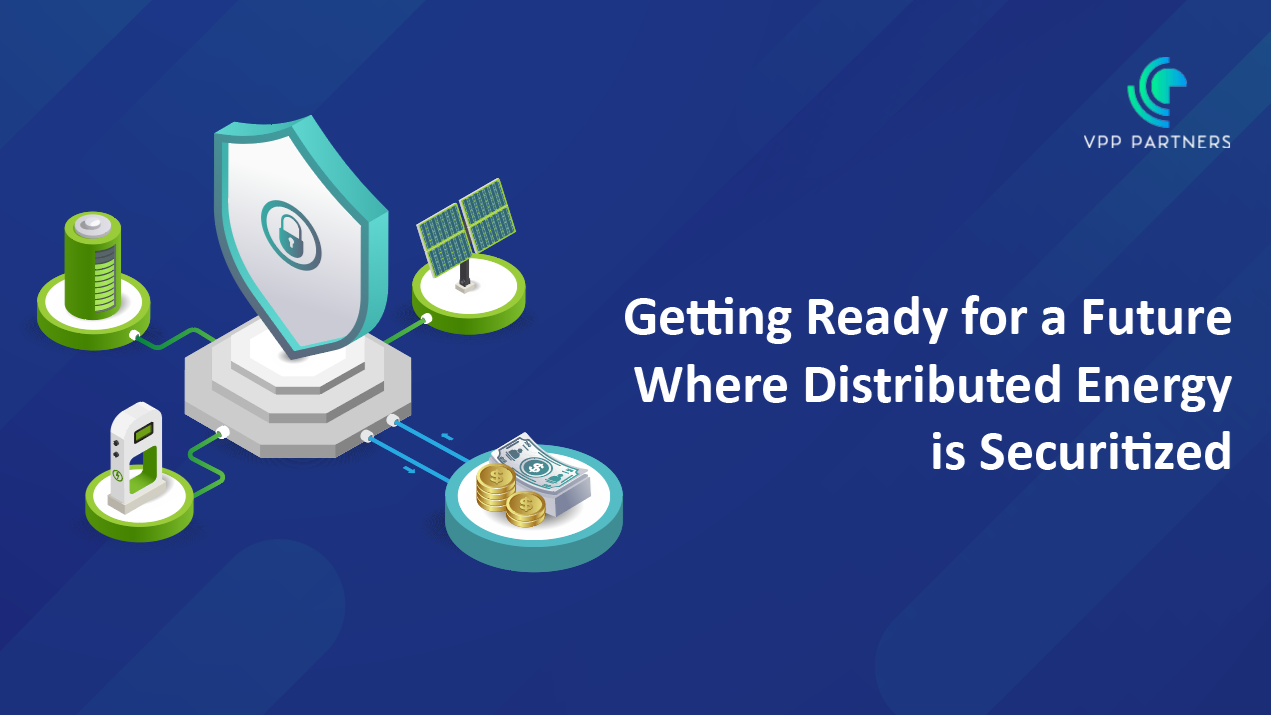
Traditionally, the focus has been on extracting value from physical assets—whether it’s demand response or PV, batteries, or increasingly EV infrastructure. However, as the sector evolves, we’re witnessing a shift toward more sophisticated approaches. Beyond Simple Value Stacks : While value stacking (leveraging multiple revenue streams from a single asset) remains relevant, forward-thinking industry players are exploring novel ways to monetise assets. For instance, aggregating and integrating distributed energy resources (DERs) into virtual power plants (VPPs) which are operated in parallel to traditional generation allows for more efficient utilisation and revenue generation compares to spot market optimisation. Decentralisation and Democratisation of Energy : The decentralisation of energy production—where smaller-scale assets contribute significantly to the overall energy mix—is a hallmark of the distributed energy sector. This democratisation empowers consumers, enabling them to become prosumers (both producers and consumers). As a result, we’re seeing community solar projects, peer-to-peer energy trading platforms, and innovation retail energy products. These trends challenge the traditional centralised utility model. Securitisation: A Complex Challenge Securitisation involves bundling and transforming illiquid assets (like DER portfolios) into tradable securities. While it’s common in other sectors (such as mortgages), applying it to DERs presents unique challenges: Diverse Consumer Needs : DER portfolios consist of various technologies with a multitude of suppliers and serve diverse consumers—residential, commercial, industrial. Each consumer has distinct energy needs, usage patterns, and risk profiles. Creating standardised securities that cater to this diversity is complex. Technology Heterogeneity : DERs use different hardware, communication protocols, and control systems. Unlike a uniform pool of mortgages, DERs lack homogeneity. This heterogeneity affects securitisation feasibility and valuation. Regulatory Uncertainty : Regulatory frameworks for DER securitisation are still evolving. Clear guidelines are essential to ensure investor confidence and liquidity in these markets. The Bi-Directional Energy System As we move toward bidirectional energy flows (where consumers can both buy and sell energy), securitisation becomes a linchpin to enable: Risk Mitigation : Investors can assess and manage risks associated with DER portfolios more effectively. Capital Access : Securitisation attracts capital from institutional investors, making it easier to fund DER projects. Market Liquidity : Tradable securities enhance liquidity, allowing for efficient buying and selling of energy assets. Achieving success in a decentralized and diverse DER landscape requires collaboration among utilities, regulators, investors, and technology providers, backed by robust data to understand the dynamics. Over the past 18 months, we’ve teamed up with industry innovators to value, buy, and sell securitised assets and offtake agreements. Let’s shape the future of energy together. Reach out to explore how we can collaborate and unlock the full potential of distributed energy resources for sustainable growth.
This article was first posted on LinkedIn on 7 June 2024