Article 2: Unpacking the Green Electricity Import Bid: A Retrospective from VPP Partners’s Perspective
This article was first posted on LinkedIn on 7 June 2024
The Inaugural Auction for 100MW Green Energy Sale to Singapore
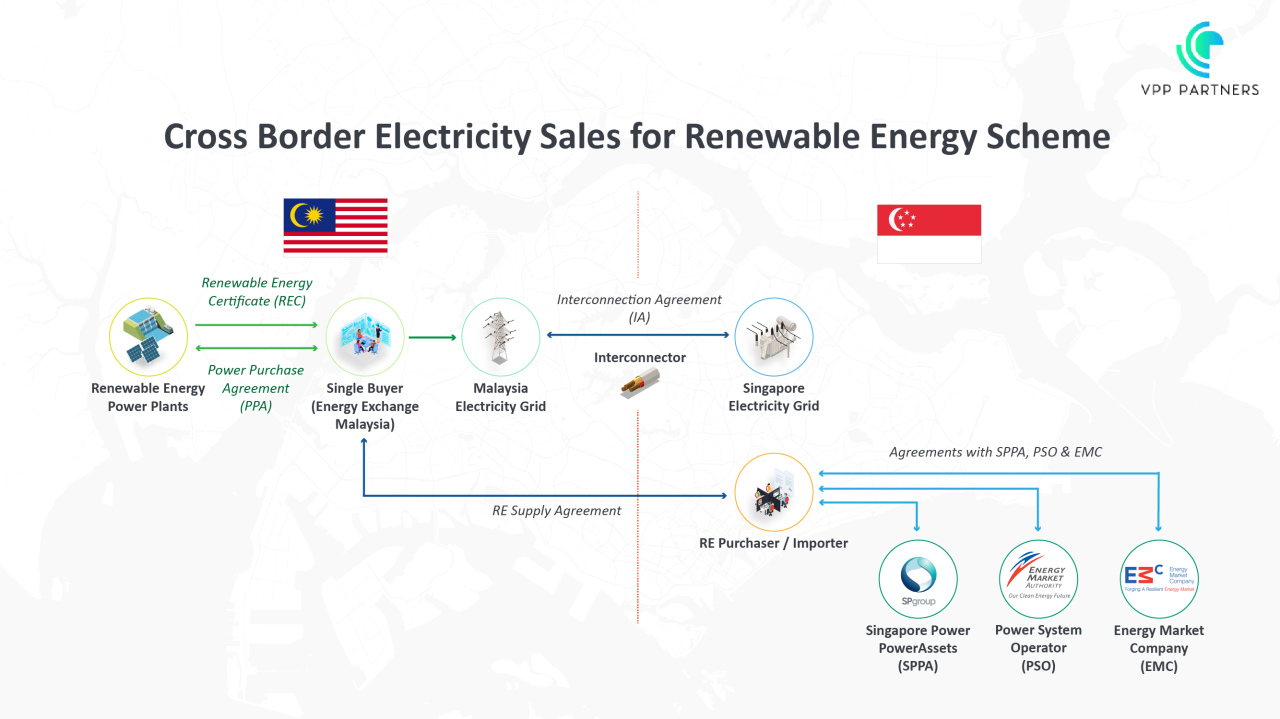
In a landmark move towards sustainability, Malaysia extended an invitation to Singaporean bidders in April 2024 to participate in the purchase of Green Electricity. This initiative, part of the Cross Border Electricity Sales for Renewable Energy Scheme (CBES RE Scheme), is facilitated through the Energy Exchange Malaysia (ENEGEM) platform.
The pilot phase of this initiative will see up to 100MW of renewable energy, split into two 50MW blocks, exported to Singapore. This energy, harnessed from solar power plants and/or hydropower stations, will be bundled with Renewable Energy Certificates (RECs) and delivered on a flat 24-hour profile.
The delivery period is set for one year, from 1 September 2024 to 31 August 2025. The auction format is continuous bidding and pay-as-bid. The two highest bids win, with each bidder allowed to win only one 50MW block.
Let’s look at the some of the key considerations.
A Tight Timeline
The timeline for this Pilot Auction is notably condensed, with just over four weeks from the Expression of Interest to the Close of the Registration Date. This compact schedule may pose challenges for some retailers or generators in formulating their bids.
Eligibility Criteria for the Auction
Bidders are required to hold a retailer or generator licence. Given the tight timeline, it may deter external entities from partnering with these licensees to participate in the bid. Additionally, Special Purpose Vehicles (SPVs) and consortiums are not permitted.
Successful bidders are required to obtain an Importer Licence from the Energy Market Authority (EMA) in Singapore. The EMA has set certain requirements, which means not all licensees will be eligible to obtain the Importer Licence. This would result in a lower number of bidders for the pilot phase.
Setting the Bid Price
In 2024, the Uniform Singapore Energy Price (USEP) experienced considerable variations monthly, with average prices ranging from $107.70 to $288.70 per MWh. While the bid price encompasses all pertinent expenses in Peninsular Malaysia, such as RECs and system charges, it does not account for costs incurred on the Singapore’s side. These include the Capacity Charge by Singapore Power PowerAssets Ltd (SPPA) for the use of the interconnector and other market-related charges. Therefore, it’s crucial for bidders to take those costs into consideration and exercise prudence when determining their bid amount.
Securing Customer Load Demand
For smaller retailers, securing a customer load of over 50MW could pose a challenge, especially as the import commences on 1 September 2024. The inability to guarantee at least 100% offtake by this date could escalate market risks.
Renewable Energy Certificates (RECs)
As RECs are only granted upon the completion of the agreement, retailers may face challenges when targeting organisations seeking to purchase green electricity. Careful considerations are needed to ensure these organisations can comply with the relevant renewable energy reporting requirements and adhere to carbon tax obligations.
While this Pilot Auction may not be as attractive as initially hoped, bidders may view this pilot as a stepping stone to gain access to future electricity import projects. Malaysia has indicated that this is a pilot phase, and the import may potentially increase to 300MW. Regardless, this initiative signifies a significant stride towards a sustainable future, underscoring the potential of cross-border cooperation in promoting renewable energy sources.
Share on...