Monetising assets within the distributed energy is only the beginning.
Traditionally, the focus has been on extracting value from physical assets—whether it’s demand response or PV, batteries, or increasingly EV infrastructure. However, as the sector evolves, we’re witnessing a shift toward more sophisticated approaches.
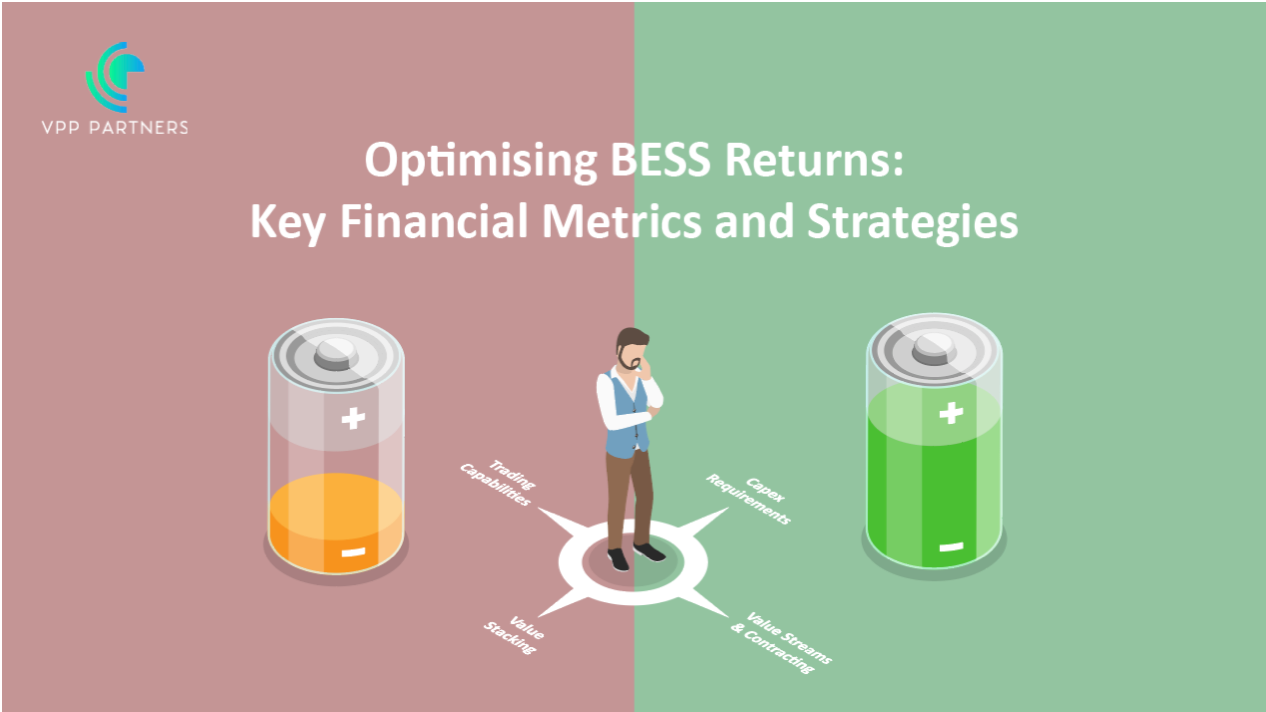
- Beyond Simple Value Stacks: While value stacking (leveraging multiple revenue streams from a single asset) remains relevant, forward-thinking industry players are exploring novel ways to monetise assets. For instance, aggregating and integrating distributed energy resources (DERs) into virtual power plants (VPPs) which are operated in parallel to traditional generation allows for more efficient utilisation and revenue generation compares to spot market optimisation.
- Decentralisation and Democratisation of Energy: The decentralisation of energy production—where smaller-scale assets contribute significantly to the overall energy mix—is a hallmark of the distributed energy sector. This democratisation empowers consumers, enabling them to become prosumers (both producers and consumers). As a result, we’re seeing community solar projects, peer-to-peer energy trading platforms, and innovation retail energy products. These trends challenge the traditional centralised utility model.
Securitisation: A Complex Challenge
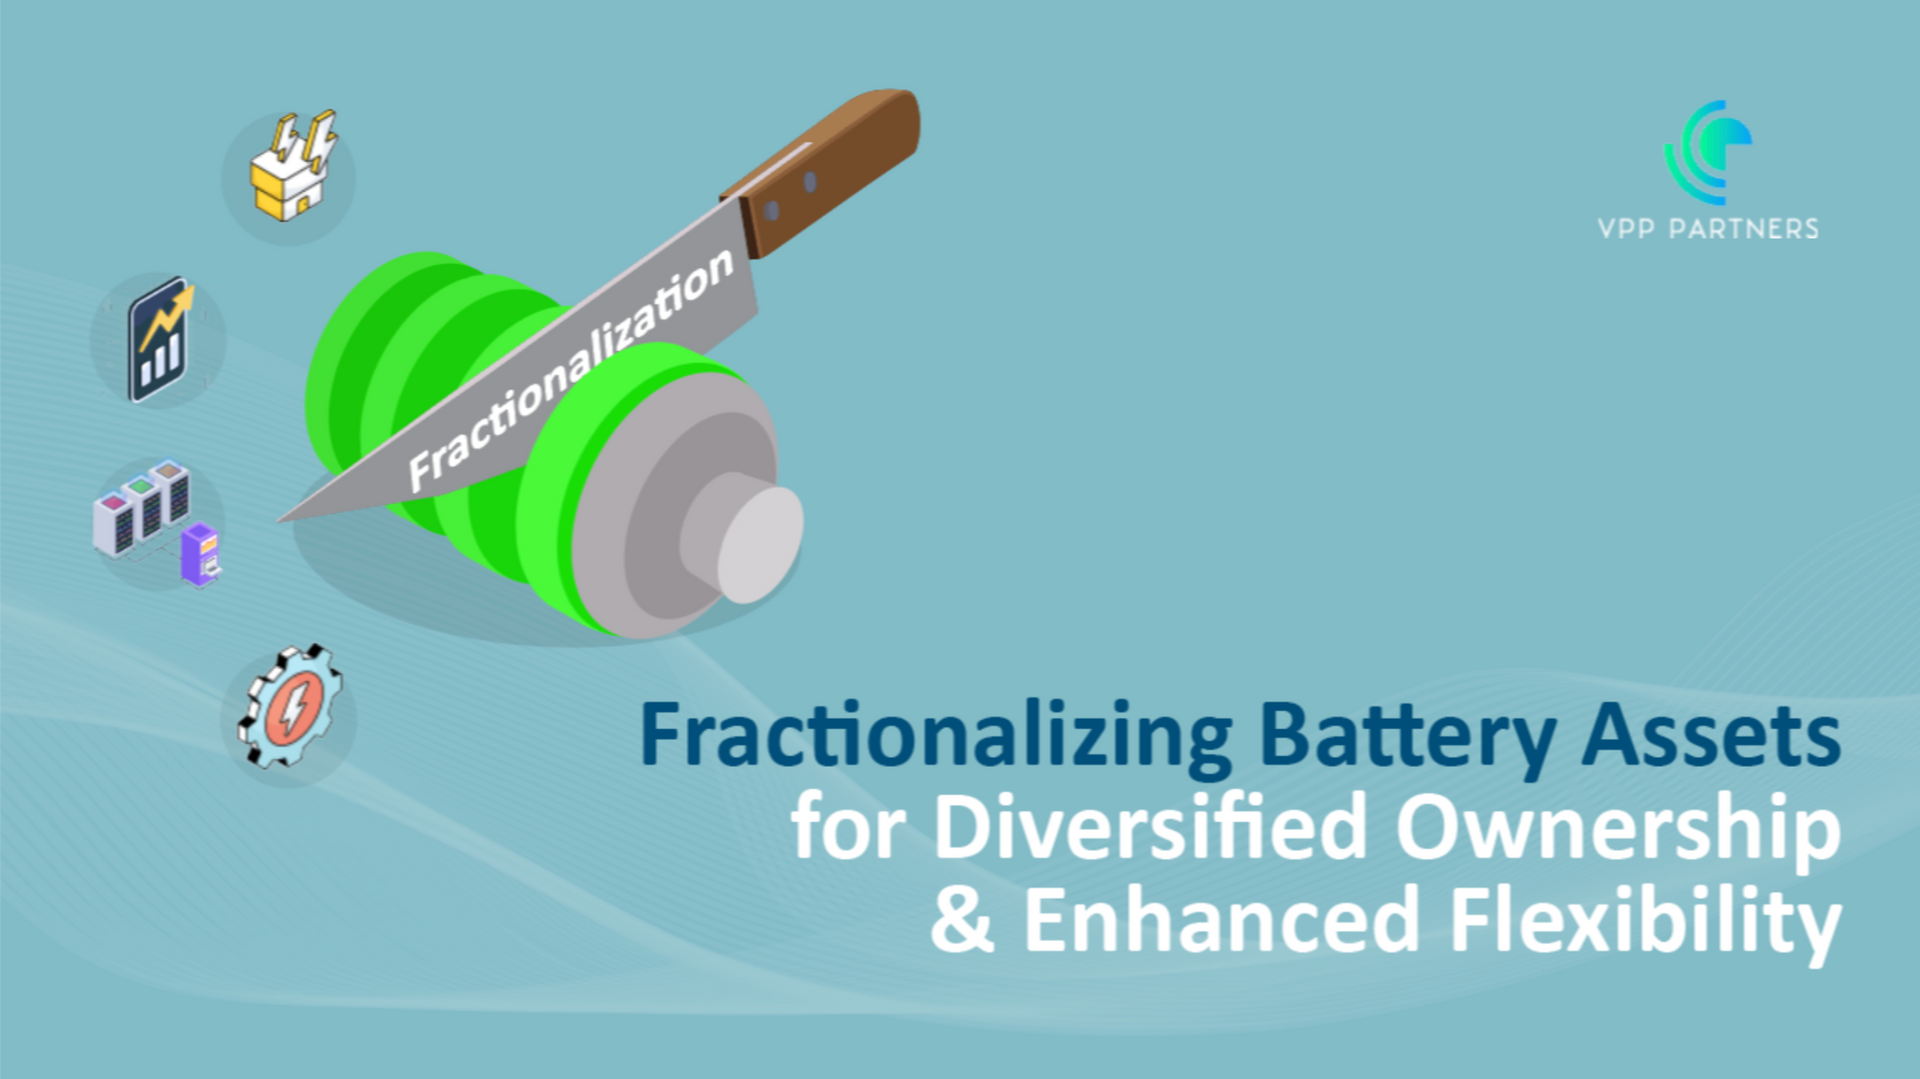
Securitisation involves bundling and transforming illiquid assets (like DER portfolios) into tradable securities. While it’s common in other sectors (such as mortgages), applying it to DERs presents unique challenges:
- Diverse Consumer Needs: DER portfolios consist of various technologies with a multitude of suppliers and serve diverse consumers—residential, commercial, industrial. Each consumer has distinct energy needs, usage patterns, and risk profiles. Creating standardised securities that cater to this diversity is complex.
- Technology Heterogeneity: DERs use different hardware, communication protocols, and control systems. Unlike a uniform pool of mortgages, DERs lack homogeneity. This heterogeneity affects securitisation feasibility and valuation.
- Regulatory Uncertainty: Regulatory frameworks for DER securitisation are still evolving. Clear guidelines are essential to ensure investor confidence and liquidity in these markets.
The Bi-Directional Energy System
As we move toward bidirectional energy flows (where consumers can both buy and sell energy), securitisation becomes a linchpin to enable:
- Risk Mitigation: Investors can assess and manage risks associated with DER portfolios more effectively.
- Capital Access: Securitisation attracts capital from institutional investors, making it easier to fund DER projects.
- Market Liquidity: Tradable securities enhance liquidity, allowing for efficient buying and selling of energy assets.
Achieving success in a decentralized and diverse DER landscape requires collaboration among utilities, regulators, investors, and technology providers, backed by robust data to understand the dynamics.
Over the past 18 months, we’ve teamed up with industry innovators to value, buy, and sell securitised assets and offtake agreements. Let’s shape the future of energy together. Reach out to explore how we can collaborate and unlock the full potential of distributed energy resources for sustainable growth.
Share on...