The Final Determination on ‘National Electricity Amendment (Unlocking CER benefits through flexible trading) Rule 2024’
In a previous article, we had covered the what the ‘DRAFT National Electricity Amendment (Unlocking CER benefits through flexible trading) Rule 2024’ was proposing, as the final determination was made on the 15th of August, we have decided to revisit the topic and point out any differences to the draft and the proposed timeline of implementation.
The proposed live date for what the new rule is proposing is the 2nd November 2026.
What are the differences between the final determination and the draft?
A few changes and clarifications have been made between the two documents, some of which are from stakeholder feedback, these include:
- NMI Service Provider Role: Initially, DNSPs were proposed to establish and maintain NMIs. The final determination assigns this role to a new accredited NMI service provider, reducing costs and implementation time. This role is equivalent to an embedded network manager role and would be provided to a contestable party.
- Large Customer Eligibility: The final rules clarify that large customers can aggregate loads across multiple sites to meet the threshold for flexible trading, which was not explicitly detailed in the draft.
- De-energisation Rules: The final determination prohibits separate de-energisation of secondary settlement points (SSPs – Secondary Settlement Points) to protect vulnerable consumers, a change from the draft rules.
- Technical Requirements: Stakeholders provided feedback on metering requirements, such as the need for meters to have alternative data access methods (e.g., smartphone apps) and concerns about flow limits and accuracy. The final determination retains the draft position but incorporates stakeholder feedback to ensure practical implementation this includes ensuring that meters are accurate and capable of handling the required flow limits without compromising performance.
- Market Participant Roles: Stakeholders expressed concerns about the complexities of compliance with dynamic operating envelopes and the allocation of tariffs. The final determination addresses these concerns by outlining clear roles and responsibilities for market participants.
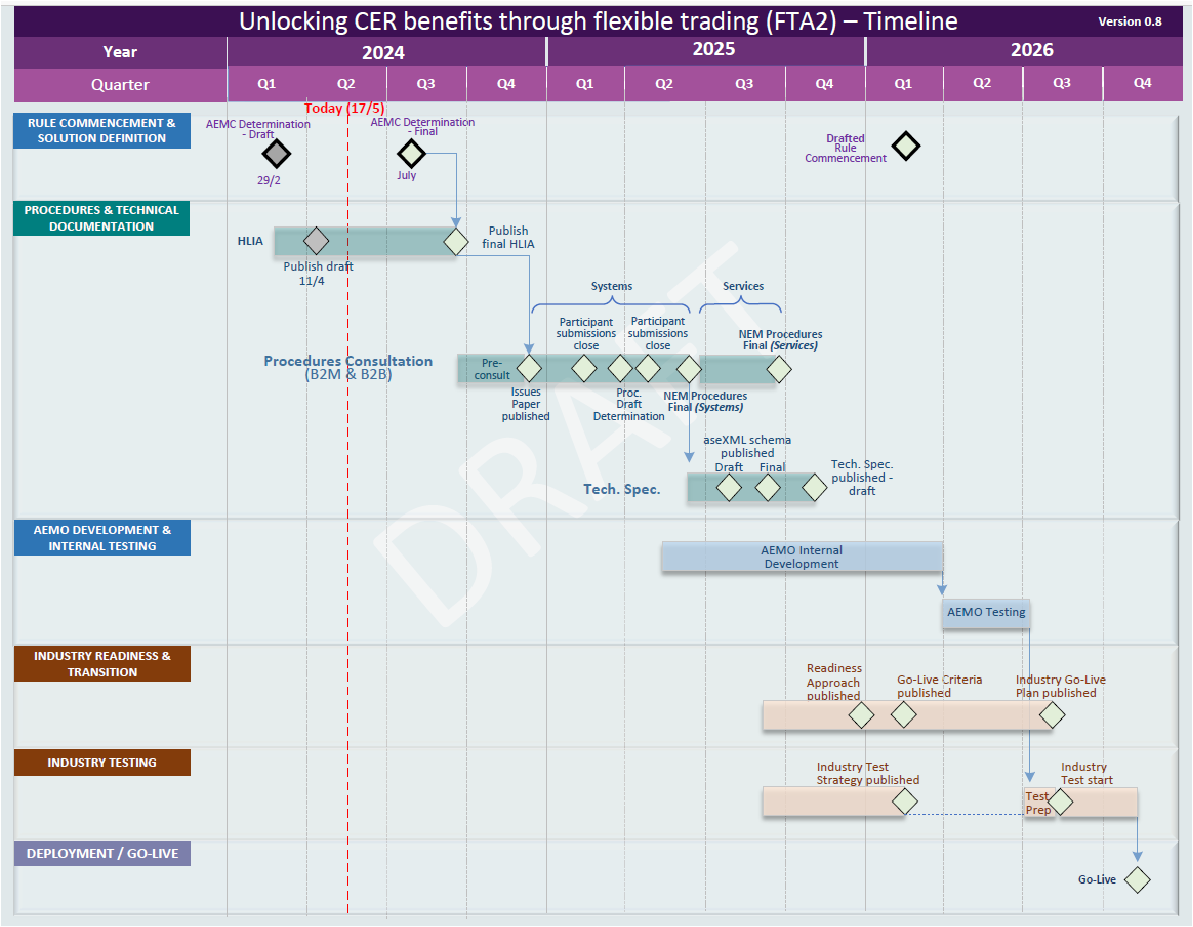
Timeline of Implementation
As this is a fairly big change, there will be different stages of implementation, as such, we have provided a timeline of events below. Please note that the timeline in the ‘Final Determination’ is still a draft and will have to be finalised by the 30th September 2025. Please note that the ‘Final determination’ was a month late, so it is likely the below will be delayed.
- 15th August 2024: Final determination made.
- 29th August 2024: removal of the requirement for meters to have a visible display (to accommodate in-built meters with displays on an app).
- 30th September 2025: AEMO guideline and procedure changes.
- 31st May 2026: arrangements related to type 9 metering.
- 1st November 2026: arrangements related to meter types 8A and 8B, SSPs, and changes to the NERR and retail contracts (the live date).
No other details are provided beyond this.
Any further questions?
If you do have any further questions or just want to discuss the determination, please get in touch at hello@vpppartners.com.
Previous article: Link
The Final Determination: Link
Share on...