Bridging the Gap Between Developers and Investors
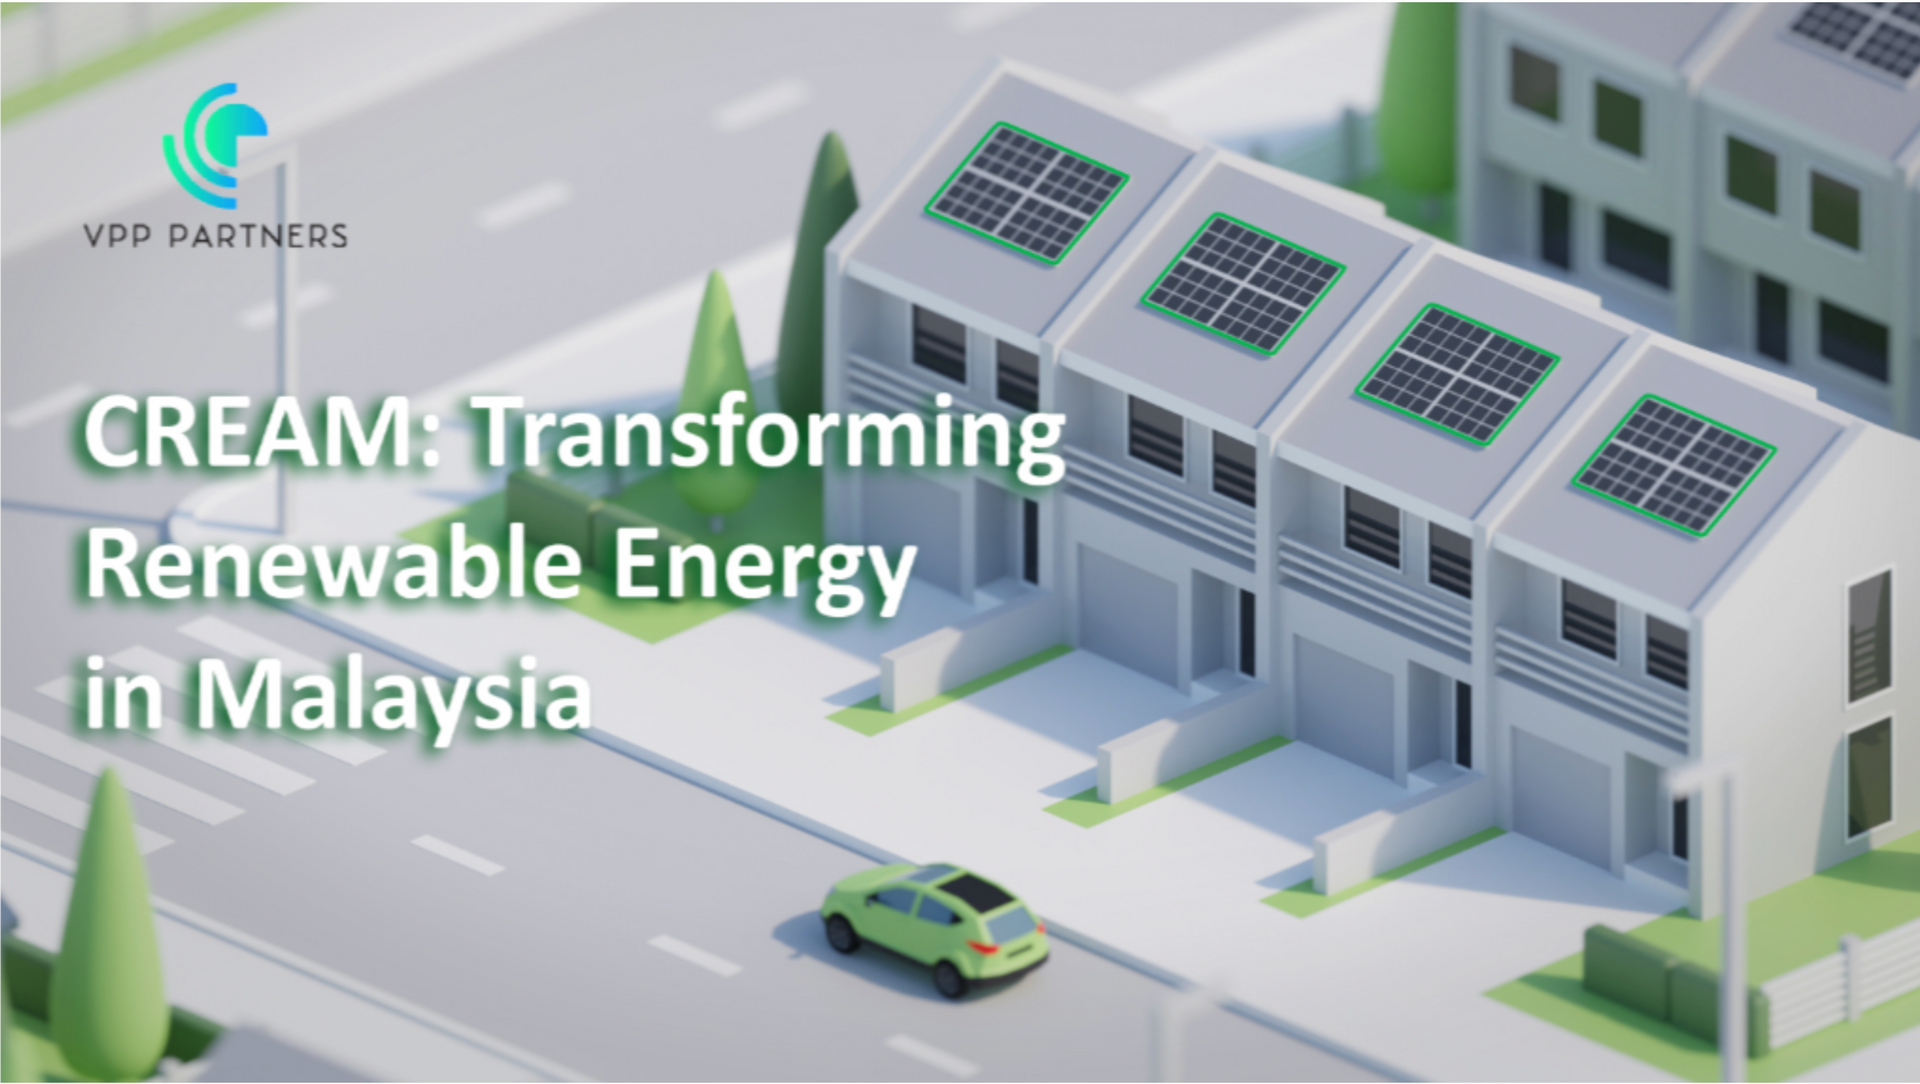
As the global shift towards sustainable energy gains momentum, solar power emerges as a beacon of promise. Yet, amidst the push for renewable solutions, a crucial dynamic often overlooked is the delicate balance between solar project developers and investors. In this article, we delve into the intricacies of solar energy investments, shedding light on the potential conflicts between developers and investors, and the path to harmonious collaboration.
The Developer's Dilemma
At the heart of solar project development lie Engineering, Procurement, and Construction (EPC) companies, entrusted with the task of bringing these initiatives to fruition. However, their inherent goal of maximising profits can sometimes clash with the interests of investors.
Challenges Faced by Developers
1. Maximising Project Revenue: EPCs may tend to oversize solar systems to enhance project revenue, leading to higher upfront costs for investors.
2. Ensuring System Performance: Balancing system design with performance guarantees can be a tightrope walk, with the risk of overpromising and underdelivering.
3. Grid Export Dynamics: The fluctuating nature of grid export policies and pricing adds another layer of complexity, impacting both project viability and investor returns.
The Investor's Perspective
Investors, on the other hand, are driven by the pursuit of optimal returns on their capital. However, conflicting objectives and uncertainties in project execution pose significant risks that cannot be overlooked.
Concerns Faced by Investors
1. Return on Investment (ROI): Oversized systems can dilute ROI by extending payback periods, affecting the overall profitability of the investment.
2. Performance Assurances: Investors rely on contractual agreements to safeguard their interests, necessitating stringent performance guarantees from developers.
3. Regulatory Risks: Evolving regulatory landscapes and grid policies introduce regulatory risks, potentially impacting the financial viability of solar projects.
Amidst these challenges, the key to unlocking the full potential of solar lies in fostering collaboration between developers and investors.
Embracing a Shared Vision
Transparent communication, performance-based contracts, and staying abreast of regulatory changes and market dynamics are essential for aligning objectives and fostering a shared vision of sustainability. Open channels of communication between developers and investors are essential to mitigate risks effectively, providing investors with assurances and developers with incentives for excellence.
The journey towards sustainable solar energy adoption demands a collective commitment from developers and investors alike. By navigating the complexities of solar investments with transparency, accountability, and a shared vision of sustainability, we can pave the way for a brighter, greener future.
As we embark on this journey, let us remember that true progress is not measured solely by financial gains but by the positive impact we leave on our planet and future generations.
Share on...